
Blog
Blog
The Property Manager’s Guide to Portfolio Analytics and Compliance
The Property Manager’s Guide to Portfolio Analytics and Compliance

The Monday call starts well. Lead volume is up. Tours look full. The dashboard is green.
Then someone asks why six two-bed homes are still empty. One team points to slow demand. Another blames no-shows. A third has a sheet that tells a very different tale.
Residential property management data should end that debate. It should show each lead, tour, app, and lease in one clear path. It should also show the unit, source, channel, time, and result tied to each step.
This is why teams have moved on from static sheets. Good property management analytics does more than sum up last month. It shows where work has stalled now. Clear property management KPIs then help the team choose the next move.
The aim is not more charts. The aim is property data insights that a team can trust and use. That is the portfolio analytics property leaders need when growth and sound controls must work side by side.
What residential property management data should you track?
Track the data that shows how work moves from one step to the next. For lettings, that means the lead, tour, app, lease, unit, source, channel, time, and result. Each field should have one clear name and one clear use.
How do you know if the data can be trusted?
Start with shared terms. A tour must mean the same thing at each site. A booked tour is not an attended tour. An app that has begun is not a full app. A signed lease is not the same as a passed check.
Small gaps can hide large leaks.
This is why residential property management data must keep each event apart.
For example, take a site that reports 80 tours. The base data shows 80 bookings. It also shows 19 cancelled slots and 14 no-shows. Just 47 tours took place.
That one label has hidden three facts. The site has demand. It also has a weak show rate. The fix may be better prompts, easier changes, or more choice of times.
Residential property management data should make that gap easy to see. Property management analytics can then split it by site, unit type, source, and channel. This turns broad trends into property data insights.
Which records should sit behind each result?
Use a short event list for each part of the work.
For demand, record the source, channel, unit type, and first reply.
For tours, record the invite, booking, change, cancel, and show.
For apps, record the start, send, review, and final result.
For units, record the live date, last key event, and next owner.
For control, record the purpose, access, review, and delete state.
The value of residential property management data comes from those links. Each result has a source and a next step.
The PMS should stay as the main record. Other tools should add clean updates to it. They should not build a second truth off to the side.
If your team is trying to join up work across the resident journey, this guide to tenant management software for resident operations gives useful context.
Clean residential property management data makes sites easy to compare. It also gives the portfolio analytics property teams need for a useful weekly call. No one has to open five sheets just to check one rate.
This also creates property data insights that site teams can check. It is the portfolio analytics property leads need when the same issue hits more than one site.
Which property management KPIs show where prospects drop out?
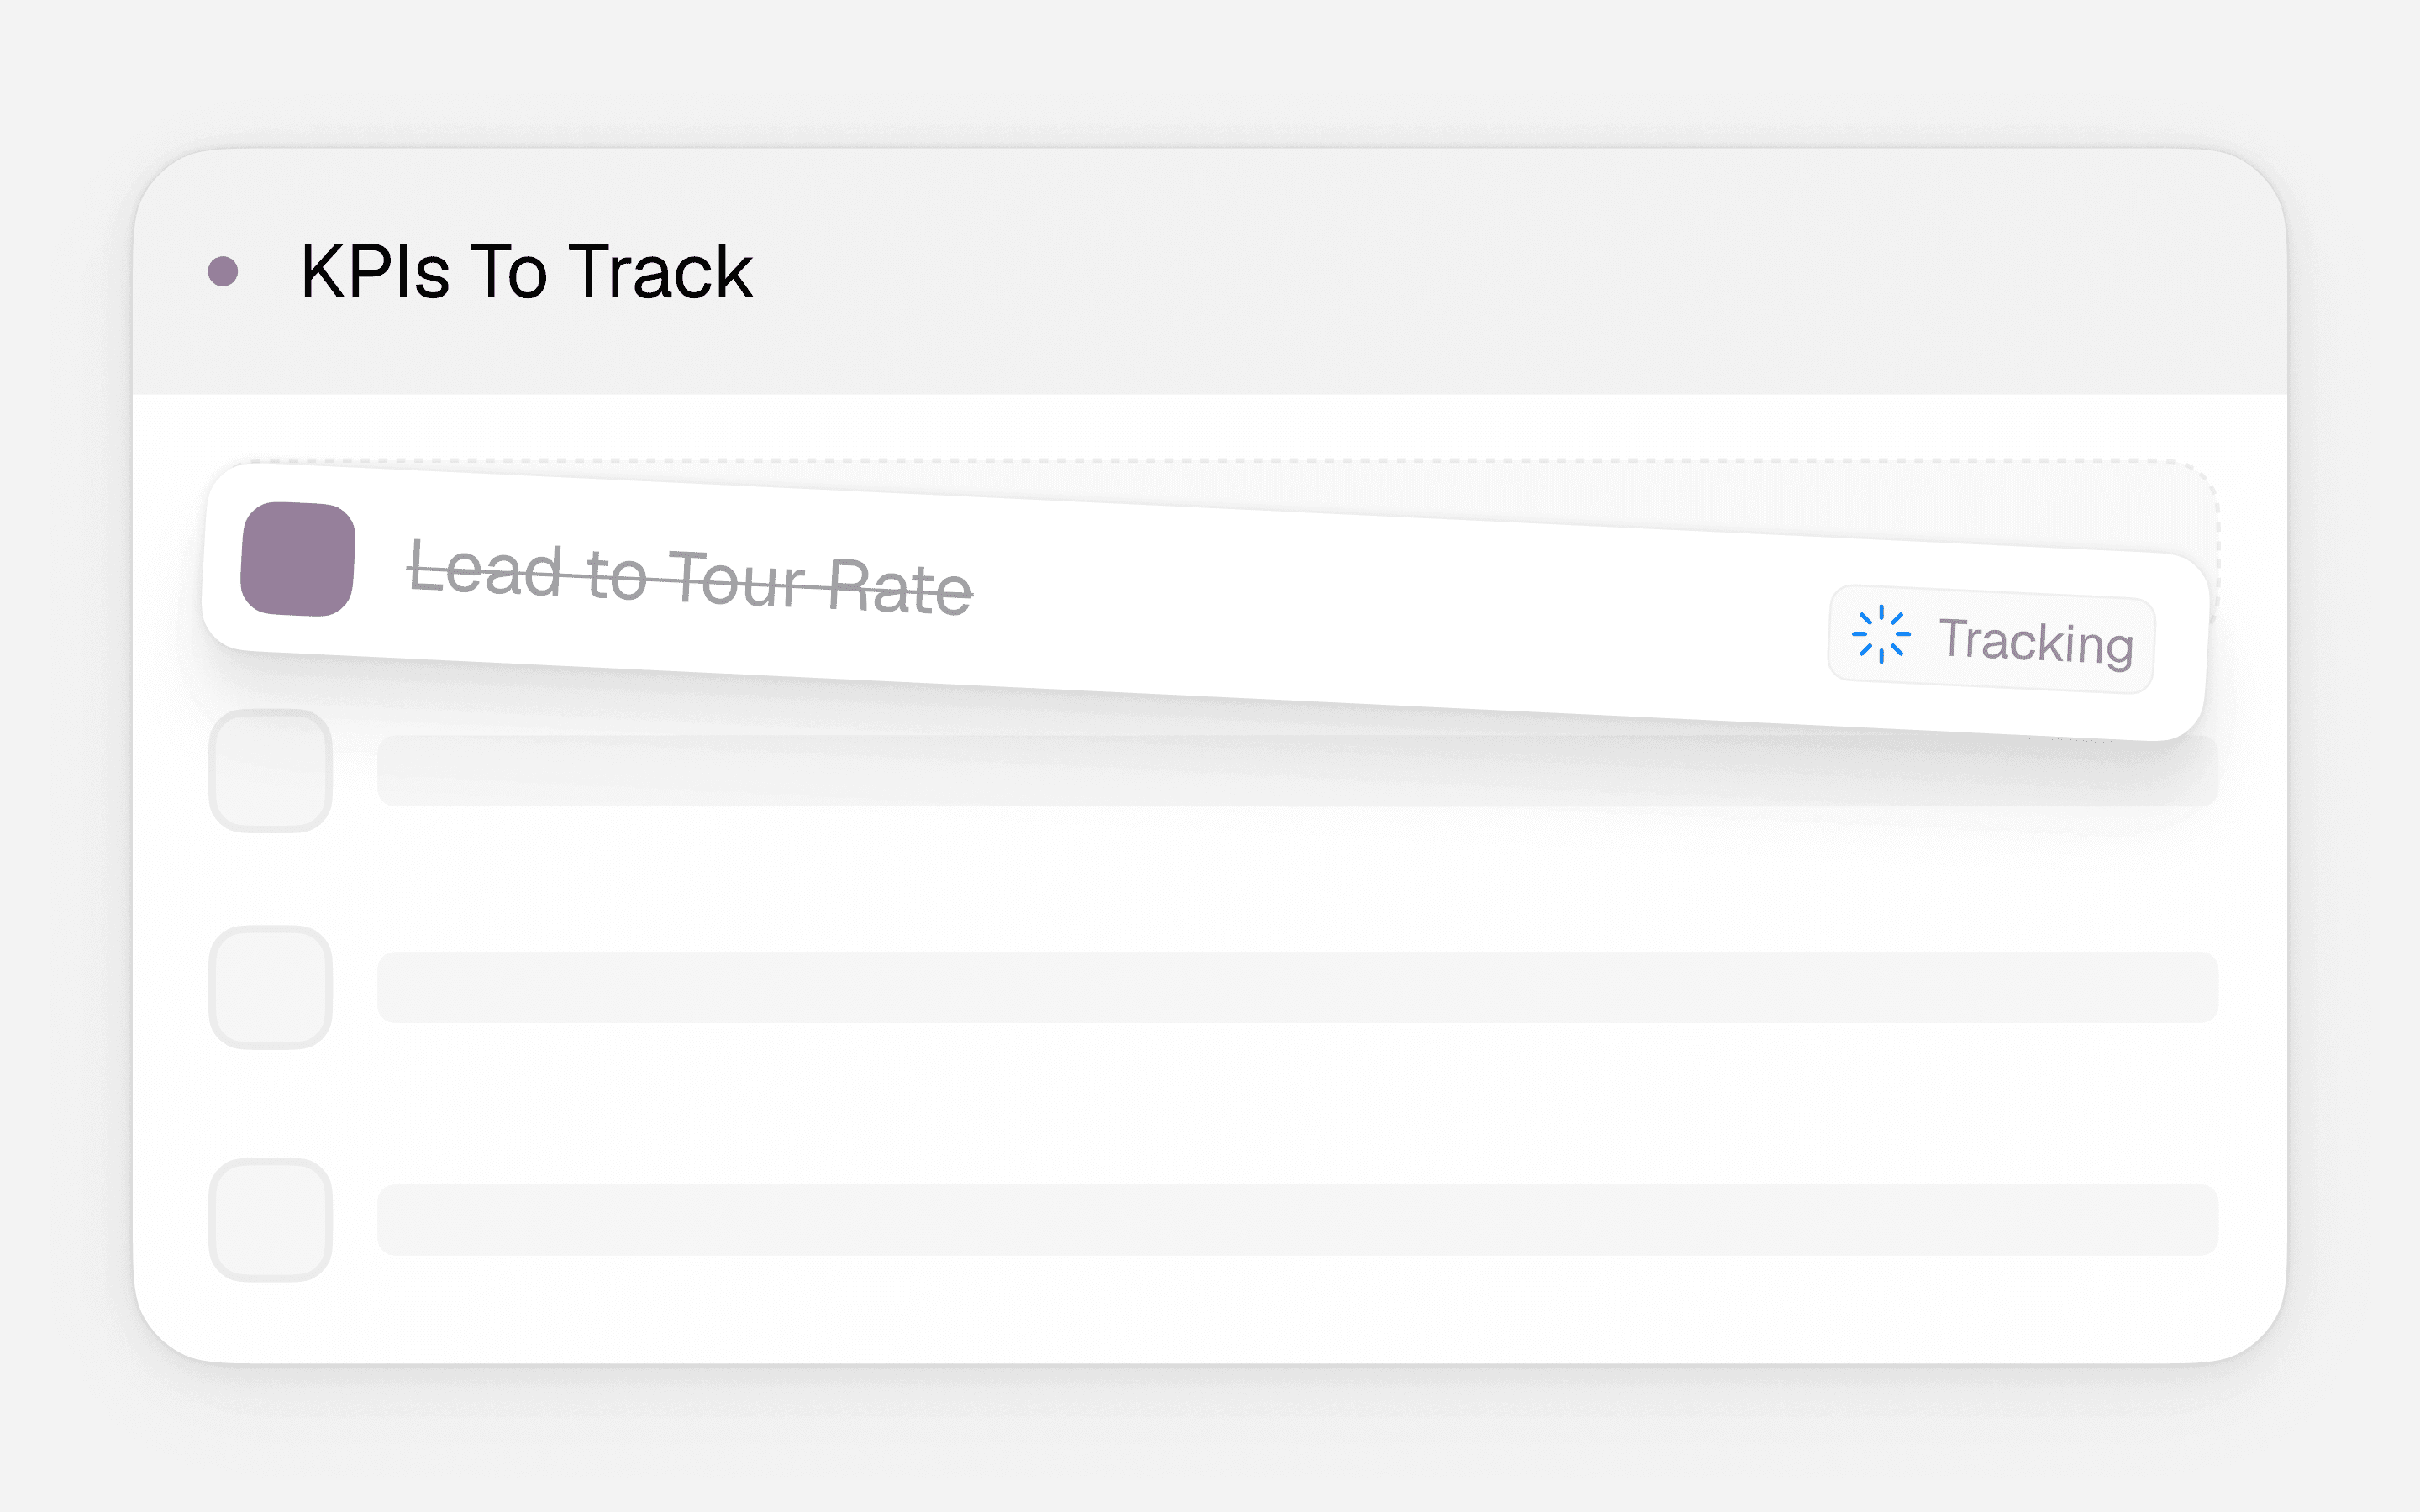
The most useful property management KPIs follow the real lease path. Start with Lead to Tour, Tour to App, Cancelled Tours, No-Show Rate, App to Closed Lease, Leads by Source, Stale Units by Unit Type, Channel Breakdown Across the Funnel, and Invited to Viewing Drop-Off.
These measures work as a set. One rate shows where the leak sits. The next rate helps show why it may be there. Good property management analytics keeps each stage apart.
Use residential property management data as the thread that joins those stages.
What do Lead to Tour and Invited to Viewing Drop-Off show?
Lead to Tour shows how many valid leads reach an attended tour.
Lead to Tour equals attended tours divided by valid leads.
Invited to Viewing Drop-Off shows how many invited leads fail to book.
Invited to Viewing Drop-Off equals invited leads who did not book divided by all invited leads.
Read both rates at once. High invite drop-off may point to a hard booking step. Strong booking with weak show rates may point to poor prompts or little scope to change the time.
This is where residential property management data earns its keep. The property management KPIs show the weak stage. Property management analytics shows which site, unit, or source drove it. The result is property data insights that lead to a clear test.
If this is the main gap in your funnel, the leasing automation guide shows how the work can move from first lead to booked tour.
Why should Tour to App be kept apart from no-shows?
Tour to App tests what happens after a prospect has seen the home. No-show and cancel rates test if the prospect got that far.
Tour to App equals apps started divided by attended tours.
Cancelled Tours equals cancelled slots divided by all booked tours.
No-Show Rate equals no-shows divided by all confirmed tours.
Do not blend these rates. If a site has few apps, the cause may be the tour. It may also be that few tours took place. The same top-line result calls for two very different fixes.
Split residential property management data by site, unit type, time, source, and channel. That makes property management analytics useful for day-to-day work. It also gives the portfolio analytics property managers need to act with less guesswork.
What does App to Closed Lease show?
App to Closed Lease shows how many full apps turn into signed leases.
A fall can point to slow follow-up, hard forms, checks, price changes, or a lack of clear next steps. It may also show that the prospect chose a different home.
Log each lost app with care. Withdrawn, declined, not complete, and no reply are not the same result.
Residential property management data should keep that detail. Property management KPIs can then show if a change worked. The property data insights will also tell leaders which loss can be fixed and which cannot.
This is the portfolio analytics property directors need when a stable lease rate hides a weak flow of new deals.
How should you use Leads by Source and Channel Breakdown?
Leads by Source shows where demand starts. Channel Breakdown shows how a lead moves through email, web chat, WhatsApp, phone, or a portal.
Keep source and channel apart. A listing site may start the lead. WhatsApp may help that same lead book a tour. The last chat did not create the lead.
Read each source through to the signed lease. A source with high lead volume may have weak tour or lease rates. A smaller source may bring far more good-fit leads.
Use residential property management data to keep the full path. Property management analytics can then show the source, channel, unit, and result. These property data insights help teams set spend and plan follow-up.
The best property management KPIs do not reward raw lead count. They show which leads move. That is the portfolio analytics property and growth teams need to plan the next month.
Why should you track Stale Units by Unit Type?
Stale Units by Unit Type shows which live homes have had no key event for a set span of time. It turns a vague risk into a short work list.
A stale studio may need a new price or new listing. A stale three-bed may face a smaller pool of leads. A home may also look live while it is not yet ready for a tour.
Use residential property management data to show the last key event and next owner. Property management analytics should flag the risk. It should not claim to know the cause.
The property management KPIs point to where the team should look. The team then adds local facts. Those property data insights create the portfolio analytics property managers can use before one more week is lost.
How can property data help with day-to-day compliance?
Property data can help by making a few basic controls easy to see. Teams should know why data is kept, who can use it, how long it stays, how a request is handled, and when a person must review a key step.
This is not a job for a dense legal dashboard. It is a job for clear fields, clear owners, and a clean trail. The European Commission guide to data protection gives the broad rules.
In practice, residential property management data should make those checks part of the work.
Are you only asking for what you need?
Each field should serve a clear task. A tour form needs enough detail to set up the visit. It does not need each file that may be used much later.
The ICO guide to data minimisation says firms should keep data that is fit for the task and no more than they need.
This helps both trust and speed. Less noise makes residential property management data easier to use. It also helps property management analytics stay tied to the work at hand.
Is old data leaving the live workflow?
Data should not stay live just because no one owns the clean-up. Give each type of record a set use, rule, owner, and review point.
The ICO guide to storage limits gives a sound base for this work.
Use a short queue for data due for review. This may not be a board-level KPI. It is still one of the property management KPIs that keeps a sound process on track.
Can a resident request be tracked from start to end?
A request to view or delete data should not spark a hunt through staff inboxes. It should enter a set flow.
The team can check who sent it, find the right records, route the case, log the choice, and update each linked system. The ICO has clear guides on the right of access and the right to erasure.
Keep the owner, state, and proof of the result. These property data insights show how the team put its own rules to work. They give the portfolio analytics property teams need when a check must go past the policy page.
When should a person stay in control?
Tech can help with repeat tasks. It can give set answers, book tours, chase a missing field, and update a record.
People should review steps that can have a major effect on a home, funds, safety, or fair care. The European Commission guide to the EU AI framework sets out the broad risk-based view.
For a property team, the task is simple. Map the flow. Set its limits. Name the point where a person can stop, check, or change it.
That choice should become part of the residential property management data. It makes property management analytics easier to test and fix. For more detail, Lette has a practical guide to GDPR and the EU AI Act in property management.
Where should resident data live and what should the audit trail show?
Resident data should live in named systems and known host regions. Access, back-ups, moves, and deletion should all have clear rules. The audit trail should show what began the task, what data was used, what was done, and who checked it.
What should you ask about where data is stored?
Ask where live data and back-ups sit. Ask which firms can touch them. Ask where support staff can log in from. Ask what takes place when the deal ends.
Data may move across a border when the right steps and terms are in place. The ICO guide to data transfers helps UK teams frame the right checks.
Access should fit the role. A leasing lead may need tour and app data. They may not need full access to debt, risk, or case notes across the whole group.
These checks keep residential property management data useful and safe. They also give property management analytics a sound base.
They also create property data insights that can be checked by a site lead or audit team. This is the portfolio analytics property leaders need when they review a case.
What should a useful audit trail record?
A clear trail should record six things.
What began the task.
The site, unit, lead, or resident tied to it.
The approved data used for the task.
The step that was planned or done.
Any check, change, or sign-off by a person.
The time and update sent back to the PMS.
These facts make property management KPIs easy to test. If the no-show rate shifts, the team can inspect the tour slots, prompts, changes, and show data behind it.
That gives the property data insights and portfolio analytics property teams can check from source to result.
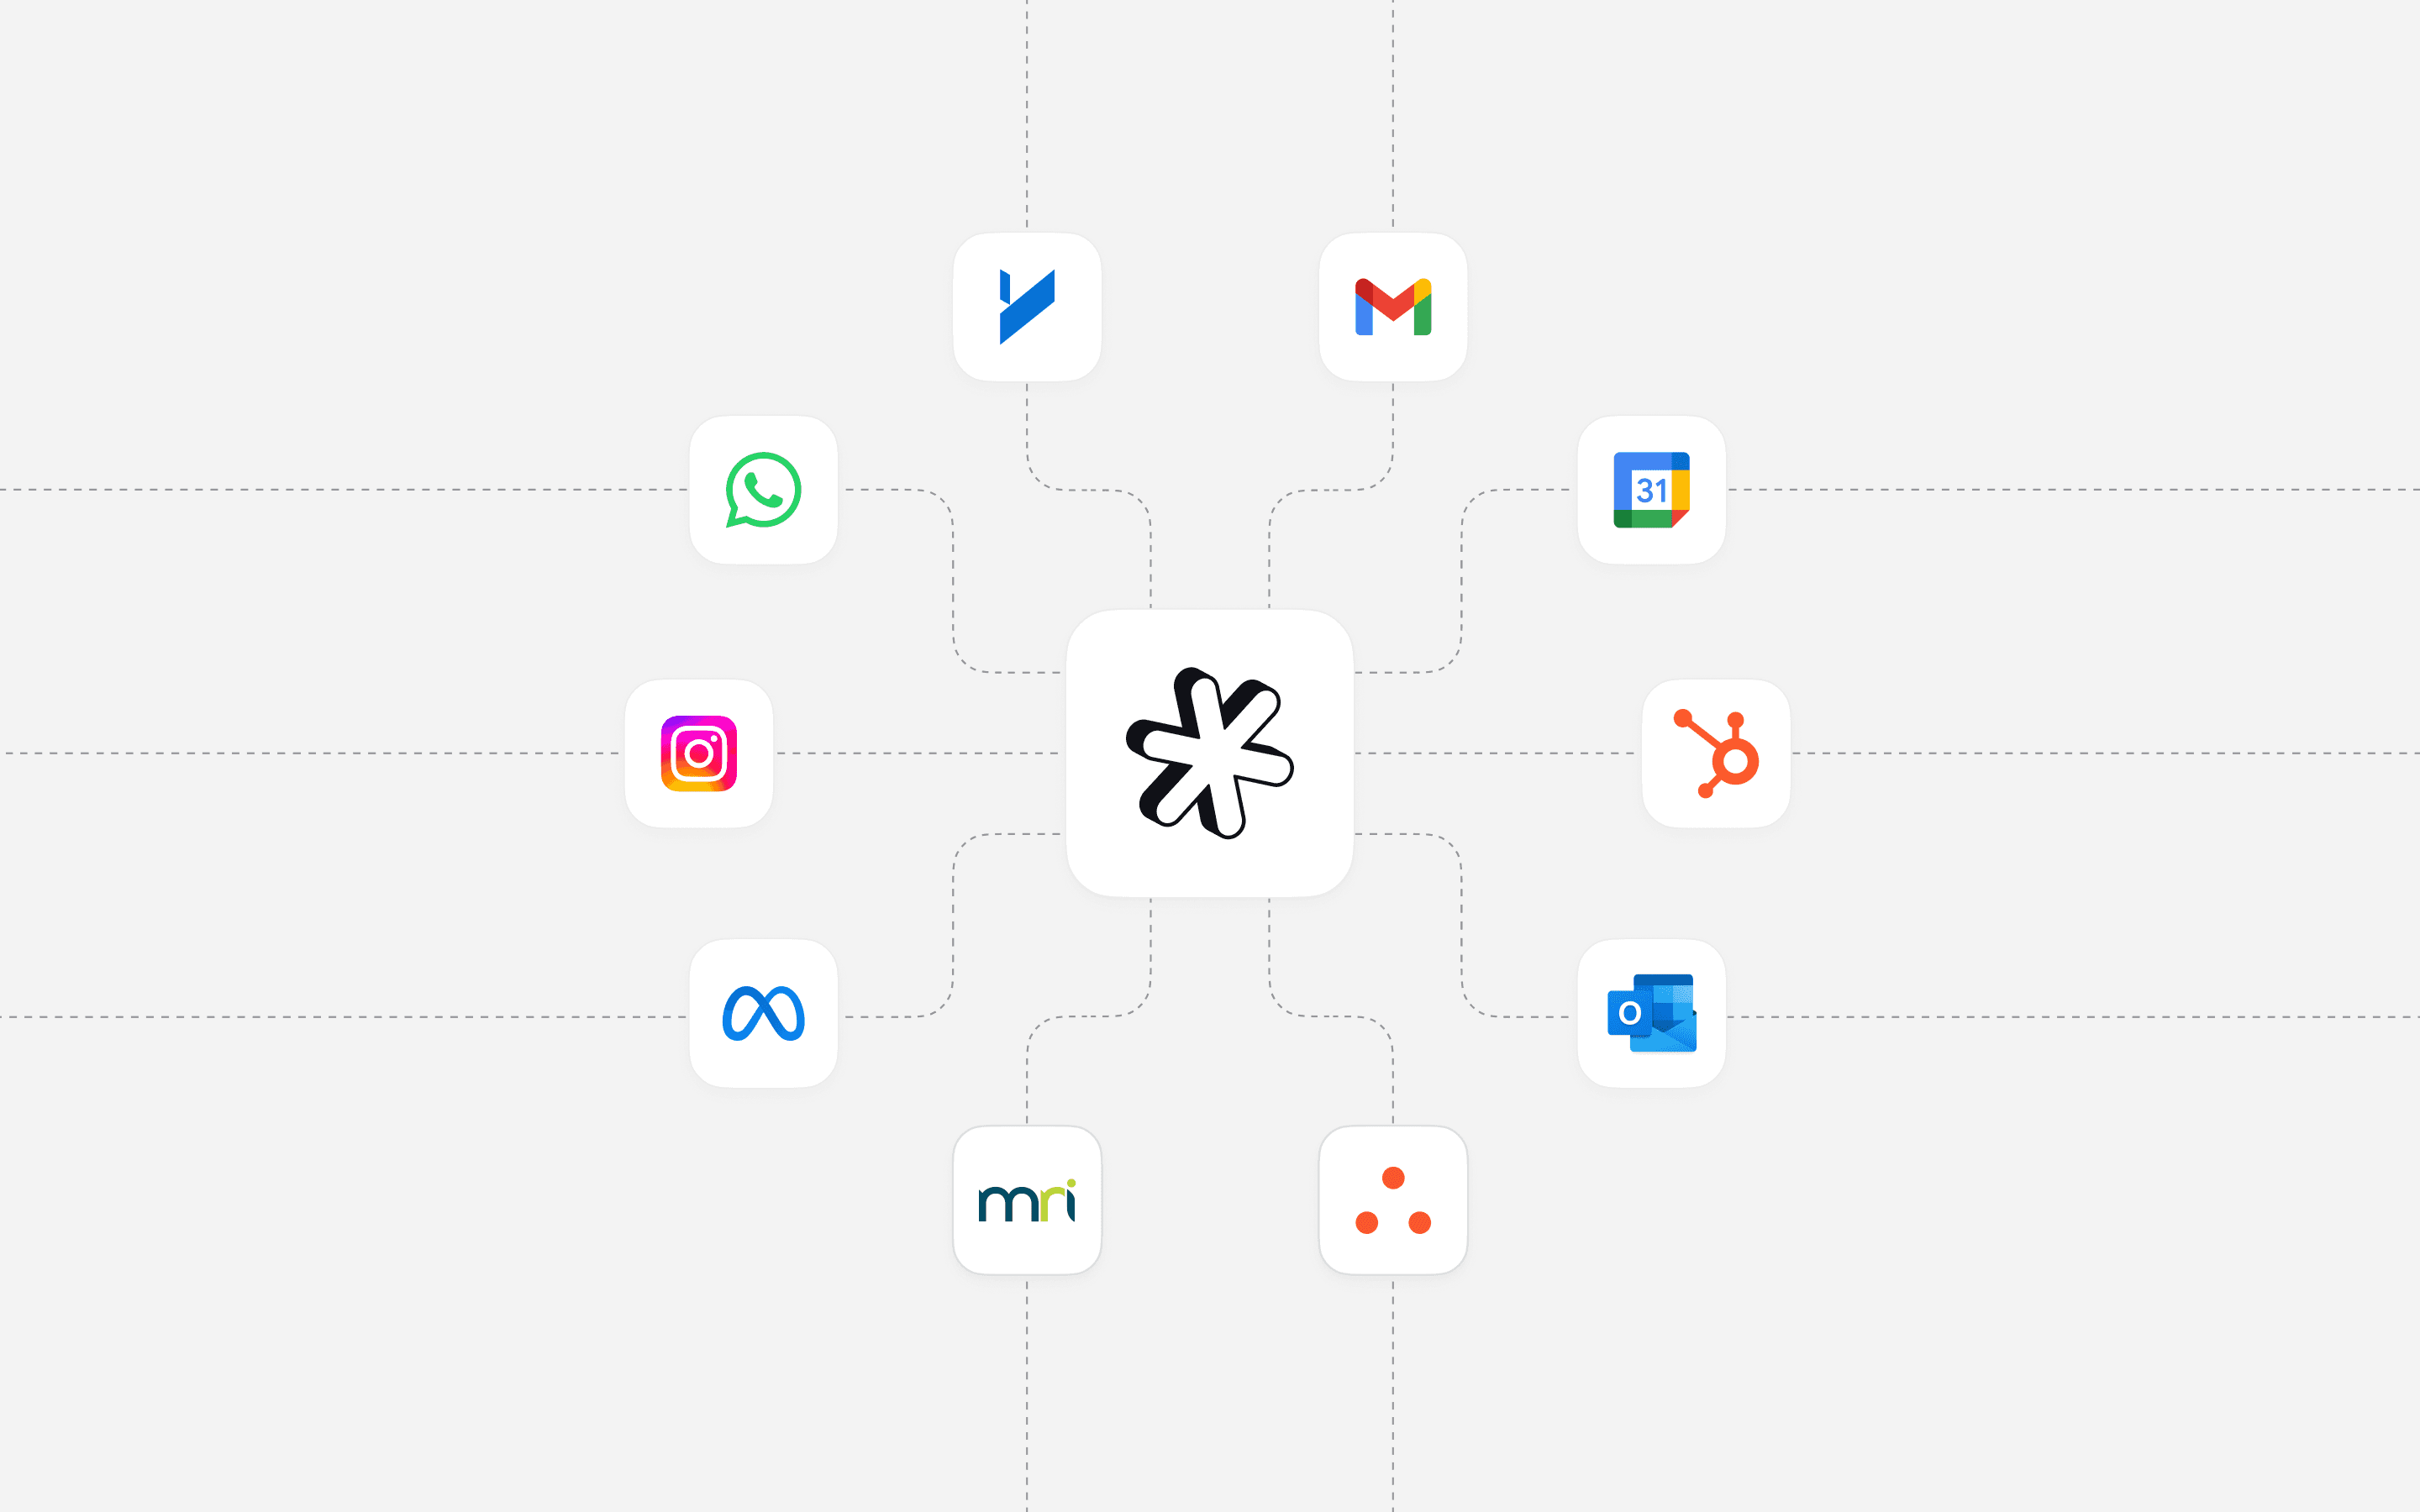
This is where an AI layer can help. Lette sits on top of the PMS and helps property teams run repeat tasks. It can use approved system data, write results back, and send cases to people when care or skill is needed. It does not replace the PMS or the team that owns the work.
The guide to automating property management tasks with AI explains that model in more depth.
The end goal is not one more screen. Connected residential property management data should help the team spot a risk, see what led to it, and move the next task on.
What do property managers ask about data and compliance?
Property managers tend to ask how data should be set up, checked, kept, and used. These are the eight most useful points to clear up.
What is residential property management data?
Residential property management data is the set of facts made through leads, tours, apps, leases, resident care, repairs, rent, and control tasks. Good data has clear terms, links to the source, and serves a set need.
How often should property management analytics be checked?
Check fast lease and service risks each week. Check portfolio results each month. Review long trends each quarter. Property management analytics should also flag high-risk gaps as they arise.
What is a good Lead to Tour rate?
There is no sound rate for all markets, sites, and lead sources. Set a clean base from your own residential property management data. Then compare like sites, unit types, and groups.
How do you work out No-Show Rate?
Divide no-shows by confirmed tours. Then times the result by 100. Keep cancels apart. This makes property management KPIs far easier to read.
Which KPIs should be on a leasing dashboard?
Start with Lead to Tour, Tour to App, Cancelled Tours, No-Show Rate, App to Closed Lease, Leads by Source, Stale Units by Unit Type, Channel Breakdown, and Invited to Viewing Drop-Off.
Does resident data have to stay in Europe or the UK?
Not in all cases. Data may move when the right terms and safeguards are in place. Ask each vendor to name its host region, key firms, access plan, back-ups, and delete process.
How should a request to delete resident data be handled?
Check the person, find the records, review what can be removed, make the agreed change in each system, and log the result. Some records may need to be kept for a valid reason.
Can AI make rental decisions on its own?
People should stay in charge of choices that can have a major effect on access to a home, funds, safety, or fair care. AI is better used for set tasks, clear prompts, record updates, and hand-offs.
How should property teams put the data to work?
Residential property management data is useful when it changes the next choice. It should show where a lead stopped, why a unit went stale, who owns the next task, and which facts sit behind the result.
Strong residential property management data also gives each site the same view of the work.
Start with one lease funnel. Agree what a lead, tour, app, and closed lease mean. Then make each site use the same terms.
Next, link each rate back to the source event. A team should be able to click from a no-show rate to the tour list behind it. That is how property management KPIs stay fair and clear.
Then build a short risk view. Show the units, leads, and tasks that need work now. Good property management analytics should lead to a task, not just a chart.
Last, add the key controls. Name who can see the data, when it is reviewed, and where a person must step in. This turns property data insights into a safe way of work.
Once the flow works for one site, use it at the next. That is the portfolio analytics property teams can grow with. It gives leaders one view, while each site can still act on local facts.
The key point is simple. Build one shared path from source to next step. When the data, task, and owner stay linked, teams can lift lease flow and keep control at the same time.
If your main gap is the work between the dashboard and the PMS, Lette Intelligence and Reporting shows how teams can turn a signal into action. To map that model to your own portfolio, you can book a conversation.
The Monday call starts well. Lead volume is up. Tours look full. The dashboard is green.
Then someone asks why six two-bed homes are still empty. One team points to slow demand. Another blames no-shows. A third has a sheet that tells a very different tale.
Residential property management data should end that debate. It should show each lead, tour, app, and lease in one clear path. It should also show the unit, source, channel, time, and result tied to each step.
This is why teams have moved on from static sheets. Good property management analytics does more than sum up last month. It shows where work has stalled now. Clear property management KPIs then help the team choose the next move.
The aim is not more charts. The aim is property data insights that a team can trust and use. That is the portfolio analytics property leaders need when growth and sound controls must work side by side.
What residential property management data should you track?
Track the data that shows how work moves from one step to the next. For lettings, that means the lead, tour, app, lease, unit, source, channel, time, and result. Each field should have one clear name and one clear use.
How do you know if the data can be trusted?
Start with shared terms. A tour must mean the same thing at each site. A booked tour is not an attended tour. An app that has begun is not a full app. A signed lease is not the same as a passed check.
Small gaps can hide large leaks.
This is why residential property management data must keep each event apart.
For example, take a site that reports 80 tours. The base data shows 80 bookings. It also shows 19 cancelled slots and 14 no-shows. Just 47 tours took place.
That one label has hidden three facts. The site has demand. It also has a weak show rate. The fix may be better prompts, easier changes, or more choice of times.
Residential property management data should make that gap easy to see. Property management analytics can then split it by site, unit type, source, and channel. This turns broad trends into property data insights.
Which records should sit behind each result?
Use a short event list for each part of the work.
For demand, record the source, channel, unit type, and first reply.
For tours, record the invite, booking, change, cancel, and show.
For apps, record the start, send, review, and final result.
For units, record the live date, last key event, and next owner.
For control, record the purpose, access, review, and delete state.
The value of residential property management data comes from those links. Each result has a source and a next step.
The PMS should stay as the main record. Other tools should add clean updates to it. They should not build a second truth off to the side.
If your team is trying to join up work across the resident journey, this guide to tenant management software for resident operations gives useful context.
Clean residential property management data makes sites easy to compare. It also gives the portfolio analytics property teams need for a useful weekly call. No one has to open five sheets just to check one rate.
This also creates property data insights that site teams can check. It is the portfolio analytics property leads need when the same issue hits more than one site.
Which property management KPIs show where prospects drop out?
The most useful property management KPIs follow the real lease path. Start with Lead to Tour, Tour to App, Cancelled Tours, No-Show Rate, App to Closed Lease, Leads by Source, Stale Units by Unit Type, Channel Breakdown Across the Funnel, and Invited to Viewing Drop-Off.
These measures work as a set. One rate shows where the leak sits. The next rate helps show why it may be there. Good property management analytics keeps each stage apart.
Use residential property management data as the thread that joins those stages.
What do Lead to Tour and Invited to Viewing Drop-Off show?
Lead to Tour shows how many valid leads reach an attended tour.
Lead to Tour equals attended tours divided by valid leads.
Invited to Viewing Drop-Off shows how many invited leads fail to book.
Invited to Viewing Drop-Off equals invited leads who did not book divided by all invited leads.
Read both rates at once. High invite drop-off may point to a hard booking step. Strong booking with weak show rates may point to poor prompts or little scope to change the time.
This is where residential property management data earns its keep. The property management KPIs show the weak stage. Property management analytics shows which site, unit, or source drove it. The result is property data insights that lead to a clear test.
If this is the main gap in your funnel, the leasing automation guide shows how the work can move from first lead to booked tour.
Why should Tour to App be kept apart from no-shows?
Tour to App tests what happens after a prospect has seen the home. No-show and cancel rates test if the prospect got that far.
Tour to App equals apps started divided by attended tours.
Cancelled Tours equals cancelled slots divided by all booked tours.
No-Show Rate equals no-shows divided by all confirmed tours.
Do not blend these rates. If a site has few apps, the cause may be the tour. It may also be that few tours took place. The same top-line result calls for two very different fixes.
Split residential property management data by site, unit type, time, source, and channel. That makes property management analytics useful for day-to-day work. It also gives the portfolio analytics property managers need to act with less guesswork.
What does App to Closed Lease show?
App to Closed Lease shows how many full apps turn into signed leases.
A fall can point to slow follow-up, hard forms, checks, price changes, or a lack of clear next steps. It may also show that the prospect chose a different home.
Log each lost app with care. Withdrawn, declined, not complete, and no reply are not the same result.
Residential property management data should keep that detail. Property management KPIs can then show if a change worked. The property data insights will also tell leaders which loss can be fixed and which cannot.
This is the portfolio analytics property directors need when a stable lease rate hides a weak flow of new deals.
How should you use Leads by Source and Channel Breakdown?
Leads by Source shows where demand starts. Channel Breakdown shows how a lead moves through email, web chat, WhatsApp, phone, or a portal.
Keep source and channel apart. A listing site may start the lead. WhatsApp may help that same lead book a tour. The last chat did not create the lead.
Read each source through to the signed lease. A source with high lead volume may have weak tour or lease rates. A smaller source may bring far more good-fit leads.
Use residential property management data to keep the full path. Property management analytics can then show the source, channel, unit, and result. These property data insights help teams set spend and plan follow-up.
The best property management KPIs do not reward raw lead count. They show which leads move. That is the portfolio analytics property and growth teams need to plan the next month.
Why should you track Stale Units by Unit Type?
Stale Units by Unit Type shows which live homes have had no key event for a set span of time. It turns a vague risk into a short work list.
A stale studio may need a new price or new listing. A stale three-bed may face a smaller pool of leads. A home may also look live while it is not yet ready for a tour.
Use residential property management data to show the last key event and next owner. Property management analytics should flag the risk. It should not claim to know the cause.
The property management KPIs point to where the team should look. The team then adds local facts. Those property data insights create the portfolio analytics property managers can use before one more week is lost.
How can property data help with day-to-day compliance?
Property data can help by making a few basic controls easy to see. Teams should know why data is kept, who can use it, how long it stays, how a request is handled, and when a person must review a key step.
This is not a job for a dense legal dashboard. It is a job for clear fields, clear owners, and a clean trail. The European Commission guide to data protection gives the broad rules.
In practice, residential property management data should make those checks part of the work.
Are you only asking for what you need?
Each field should serve a clear task. A tour form needs enough detail to set up the visit. It does not need each file that may be used much later.
The ICO guide to data minimisation says firms should keep data that is fit for the task and no more than they need.
This helps both trust and speed. Less noise makes residential property management data easier to use. It also helps property management analytics stay tied to the work at hand.
Is old data leaving the live workflow?
Data should not stay live just because no one owns the clean-up. Give each type of record a set use, rule, owner, and review point.
The ICO guide to storage limits gives a sound base for this work.
Use a short queue for data due for review. This may not be a board-level KPI. It is still one of the property management KPIs that keeps a sound process on track.
Can a resident request be tracked from start to end?
A request to view or delete data should not spark a hunt through staff inboxes. It should enter a set flow.
The team can check who sent it, find the right records, route the case, log the choice, and update each linked system. The ICO has clear guides on the right of access and the right to erasure.
Keep the owner, state, and proof of the result. These property data insights show how the team put its own rules to work. They give the portfolio analytics property teams need when a check must go past the policy page.
When should a person stay in control?
Tech can help with repeat tasks. It can give set answers, book tours, chase a missing field, and update a record.
People should review steps that can have a major effect on a home, funds, safety, or fair care. The European Commission guide to the EU AI framework sets out the broad risk-based view.
For a property team, the task is simple. Map the flow. Set its limits. Name the point where a person can stop, check, or change it.
That choice should become part of the residential property management data. It makes property management analytics easier to test and fix. For more detail, Lette has a practical guide to GDPR and the EU AI Act in property management.
Where should resident data live and what should the audit trail show?
Resident data should live in named systems and known host regions. Access, back-ups, moves, and deletion should all have clear rules. The audit trail should show what began the task, what data was used, what was done, and who checked it.
What should you ask about where data is stored?
Ask where live data and back-ups sit. Ask which firms can touch them. Ask where support staff can log in from. Ask what takes place when the deal ends.
Data may move across a border when the right steps and terms are in place. The ICO guide to data transfers helps UK teams frame the right checks.
Access should fit the role. A leasing lead may need tour and app data. They may not need full access to debt, risk, or case notes across the whole group.
These checks keep residential property management data useful and safe. They also give property management analytics a sound base.
They also create property data insights that can be checked by a site lead or audit team. This is the portfolio analytics property leaders need when they review a case.
What should a useful audit trail record?
A clear trail should record six things.
What began the task.
The site, unit, lead, or resident tied to it.
The approved data used for the task.
The step that was planned or done.
Any check, change, or sign-off by a person.
The time and update sent back to the PMS.
These facts make property management KPIs easy to test. If the no-show rate shifts, the team can inspect the tour slots, prompts, changes, and show data behind it.
That gives the property data insights and portfolio analytics property teams can check from source to result.
This is where an AI layer can help. Lette sits on top of the PMS and helps property teams run repeat tasks. It can use approved system data, write results back, and send cases to people when care or skill is needed. It does not replace the PMS or the team that owns the work.
The guide to automating property management tasks with AI explains that model in more depth.
The end goal is not one more screen. Connected residential property management data should help the team spot a risk, see what led to it, and move the next task on.
What do property managers ask about data and compliance?
Property managers tend to ask how data should be set up, checked, kept, and used. These are the eight most useful points to clear up.
What is residential property management data?
Residential property management data is the set of facts made through leads, tours, apps, leases, resident care, repairs, rent, and control tasks. Good data has clear terms, links to the source, and serves a set need.
How often should property management analytics be checked?
Check fast lease and service risks each week. Check portfolio results each month. Review long trends each quarter. Property management analytics should also flag high-risk gaps as they arise.
What is a good Lead to Tour rate?
There is no sound rate for all markets, sites, and lead sources. Set a clean base from your own residential property management data. Then compare like sites, unit types, and groups.
How do you work out No-Show Rate?
Divide no-shows by confirmed tours. Then times the result by 100. Keep cancels apart. This makes property management KPIs far easier to read.
Which KPIs should be on a leasing dashboard?
Start with Lead to Tour, Tour to App, Cancelled Tours, No-Show Rate, App to Closed Lease, Leads by Source, Stale Units by Unit Type, Channel Breakdown, and Invited to Viewing Drop-Off.
Does resident data have to stay in Europe or the UK?
Not in all cases. Data may move when the right terms and safeguards are in place. Ask each vendor to name its host region, key firms, access plan, back-ups, and delete process.
How should a request to delete resident data be handled?
Check the person, find the records, review what can be removed, make the agreed change in each system, and log the result. Some records may need to be kept for a valid reason.
Can AI make rental decisions on its own?
People should stay in charge of choices that can have a major effect on access to a home, funds, safety, or fair care. AI is better used for set tasks, clear prompts, record updates, and hand-offs.
How should property teams put the data to work?
Residential property management data is useful when it changes the next choice. It should show where a lead stopped, why a unit went stale, who owns the next task, and which facts sit behind the result.
Strong residential property management data also gives each site the same view of the work.
Start with one lease funnel. Agree what a lead, tour, app, and closed lease mean. Then make each site use the same terms.
Next, link each rate back to the source event. A team should be able to click from a no-show rate to the tour list behind it. That is how property management KPIs stay fair and clear.
Then build a short risk view. Show the units, leads, and tasks that need work now. Good property management analytics should lead to a task, not just a chart.
Last, add the key controls. Name who can see the data, when it is reviewed, and where a person must step in. This turns property data insights into a safe way of work.
Once the flow works for one site, use it at the next. That is the portfolio analytics property teams can grow with. It gives leaders one view, while each site can still act on local facts.
The key point is simple. Build one shared path from source to next step. When the data, task, and owner stay linked, teams can lift lease flow and keep control at the same time.
If your main gap is the work between the dashboard and the PMS, Lette Intelligence and Reporting shows how teams can turn a signal into action. To map that model to your own portfolio, you can book a conversation.

Ready to simplify your property operations?
See how Lette helps leasing and residential teams automate daily work, respond faster, and scale with confidence.

167-169 Great Portland Street 5th Floor London W1W 5PF
33 Fitzwilliam Place, Dublin 2 Carroll Estates Mews DUBLIN 2 D02 A5W0 IRELAND
info@lette.ai

Ready to simplify your property operations?
See how Lette helps leasing and residential teams automate daily work, respond faster, and scale with confidence.
167-169 Great Portland Street 5th Floor London W1W 5PF
33 Fitzwilliam Place, Dublin 2 Carroll Estates Mews DUBLIN 2 D02 A5W0 IRELAND
info@lette.ai
Ready to simplify your property operations?
See how Lette helps leasing and residential teams automate daily work, respond faster, and scale with confidence.
167-169 Great Portland Street 5th Floor London W1W 5PF
33 Fitzwilliam Place, Dublin 2 Carroll Estates Mews DUBLIN 2 D02 A5W0 IRELAND
info@lette.ai
Ready to simplify your property operations?
See how Lette helps leasing and residential teams automate daily work, respond faster, and scale with confidence.
167-169 Great Portland Street 5th Floor London W1W 5PF
33 Fitzwilliam Place, Dublin 2 Carroll Estates Mews DUBLIN 2 D02 A5W0 IRELAND
info@lette.ai